“The head of the hurricane research division, Hugh Willoughby, told me that hurricanologists can predict the behavior of storms if those storms behave predictably.” — Erik Larson
Hurricane season is officially from June 1 to November 30, so it’s not officially over yet. A look at the Atlantic, however, shows no tropical depressions developing and the National Hurricane Center’s Seven-Day Graphical Tropical Weather Outlook for November 22 shows that “Tropical cyclone activity is not expected during the next 7 days.”
For all practical purposes, the 2024 hurricane season is finally over. Thank goodness.
Now we need to plan for the 2025 hurricane season, and in general, manage the risk of hurricane damage to our facilities in the coming years.
The 2024 Hurricane Season
The Atlantic basin spawned 5 major hurricanes during the 2024 season:
Hurricane Beryl, a Category 5 hurricane that walloped Texas and the Midwest, that lasted from June 28 to July 11.
Hurricane Helene, a Category 4 hurricane that formed on September 24, came ashore in the Florida panhandle, then continued its northward track inland—as a hurricane—until it finally petered out on September 29.
Hurricane Milton, a Category 5 hurricane that formed in the Caribbean on October 5 and tore across the Florida peninsula before heading out to sea to dissipate in the Atlantic on October 13.
There was also Hurricane Kirk, Category 4, September 29 to October 13, which never made landfall in North America, but did a lot of damage in Europe after making landfall in France. And there was Hurricane Rafael, Category 3, November 4 to 10, which formed and died in the Caribbean, but not before devastating Cuba. (It’s important to remember that not all hurricanes born in the Atlantic basin strike North America, or even make landfall at all.)
Five major hurricanes—a hurricane that is Category 3, 4, or 5 on the Saffir-Simpson Hurricane Wind Scale—in one year. In the 124 years since the turn of the last century, there have only been eight years with more major hurricanes, and four of those have been in the last two decades.
How Frequently Will a Hurricane Strike a Particular Plant?
In 2017, Maria Vega-Westhoff and I presented a paper at the 12th Global Congress on Process Safety that we called “Black Swans and Meteors: ‘Worst Case Scenarios’ and Why We Need to Ignore Them.” One of our objectives was to provide process risk specialists with the likelihoods they could use to calculate the risk of rare events, including hurricanes.
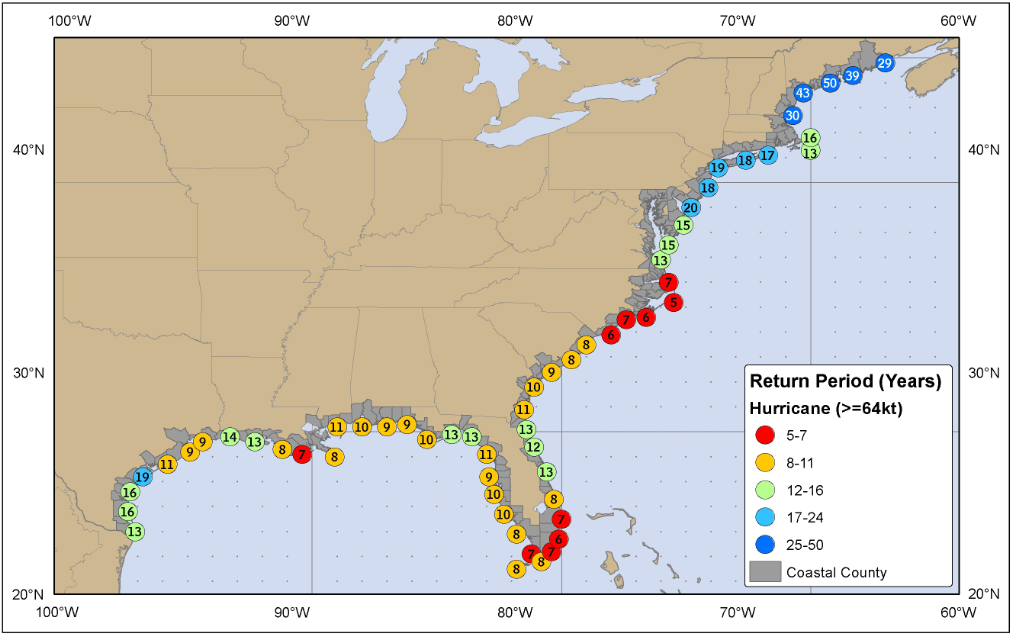
We based our recommendations on data that was available to us at the time. Along with the statement that on average “1.77 hurricanes per year struck the United States during the years from 1851 to 2004,” we included a table showing the frequency of hurricanes per century per 100 miles of coastline, by state, from Texas to Maine. At about the same time, the National Hurricane Center (NHC) was developing a similar analysis, based on data from 1886 through 2010, that they presented as a map. It is more granular than the table we developed, looking at hurricane data on a county-by-county basis as it did, rather than on a state-by-state basis, as we did.
Figure 1 shows the Return Period, or the mean time between hurricanes, for each U.S. county along our southern and eastern coasts, starting with Cameron County, Texas and following the Gulf coast around the Florida peninsula and continuing up to Washington County, Maine.

Figure 1. Mean time between hurricanes (Return Period), by coastal U.S. county (image by NOAA)
At the time, I noted that climate change would undoubtedly have an impact on the rate, but it was much too early to distinguish any upward tick between normal variation in the system or an indication of an upward trend.
Hurricanes Are Getting More Frequent
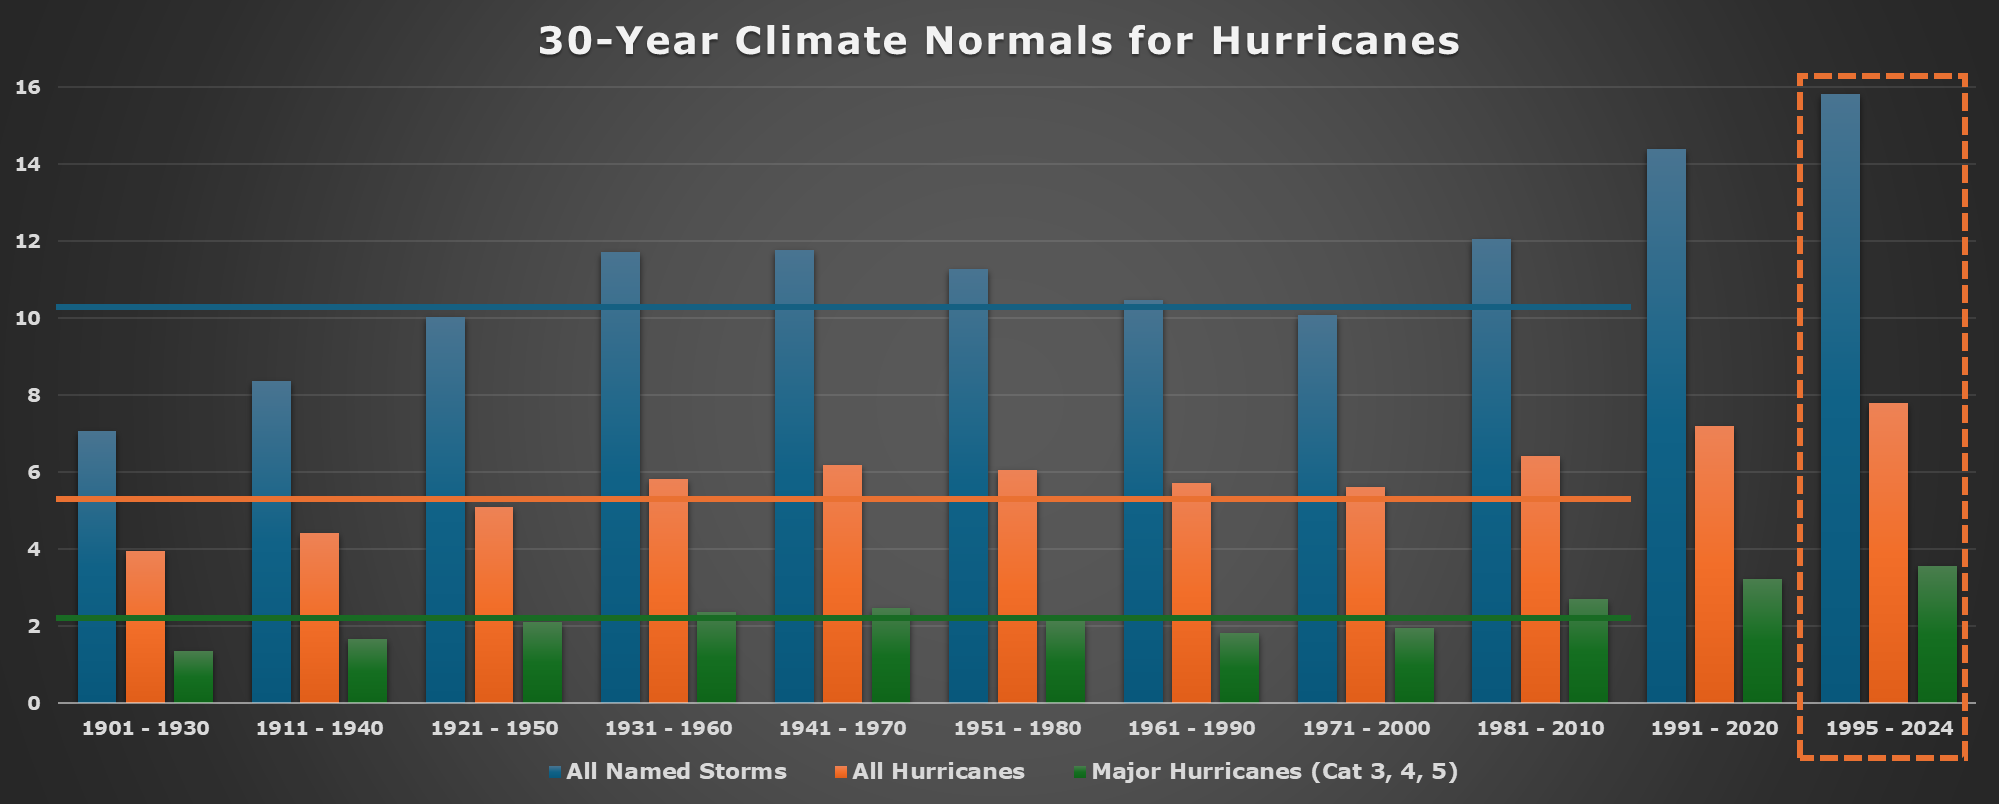
The National Centers for Environmental Information (NCEI) calculates U.S. Climate Normals at the end of every decade. The Climate Normals are based on the previous 30 years, and the NCEI produced its first Climate Normals in the 1950s. The data for calculating climate normal for hurricanes goes back even further, though; Figure 2 shows the climate normals for the 20th and 21st centuries.
Through 2010, there were fluctuations in the average number of named storms, hurricanes, and major hurricanes per year. The 30-year climate normal ending in 2010 showed an upward tick, but it wasn’t until 2020 that it became obvious that an upward trend had begun with the climate normal ending in 2000. The 30-year average ending in 2024—not an official number from the NCEI but calculated the same way—confirms that upward trend.

Figure 2. Twentieth and Twenty First Century 30-Year Climate Normals for Hurricanes
The average number of named storms between 1886 and 2010, the period documented in Figure 1, was 10.25 per year. During the last five years, 2020 through 2024, the average was 20.6 per year, over twice as many.
Likewise, the average number of hurricanes between 1886 and 2010 was 5.55 per year; the average number during the last five years was 9.4 per year. Again, about double.
Finally, the average number of major hurricanes between 886 and 2010 was 2.06 per year. Not surprisingly, the average number during the last five years was 4.2. Once again, over twice as many.
Hurricanes are getting more frequent, and it doesn’t appear to be temporary.
Are Hurricanes Getting Stronger?
All tropical cyclones – tropical storms, hurricanes, and major hurricanes – start as tropical depressions. Tropical depressions are circulating storms with no storm front. Some increase in intensity to become tropical storms, characterized by wind speeds greater than 39 mph. When the wind speed increases to greater than 74 mph, the tropical storm becomes a Category 1 Hurricane. Increasing windspeed raises the category, with Major Hurricanes having a windspeed of 111 mph or greater.
If hurricanes were getting stronger, the number of tropical cyclones that make the transition from tropical storm to hurricane would be greater. Similarly, the number of tropical cyclones that make the transition from tropical storm to major hurricane would also be greater.
A review of hurricane data shows that 53% of tropical storms become hurricanes. The range for climate normals is from 49% to 56%, with no trend. Twenty percent of tropical storms transition all the way to major hurricanes. The range for climate normal is from 17% to 22%, again with no trend.
So, it appears that while the frequency of hurricanes is increasing, the strength is not. It’s just that with more tropical depressions developing in the Atlantic, we have proportionally more major hurricanes.
Twice As Often
There has been a tendency over the past decade to blame every major weather event on global warming and the resulting climate change. While the blame is well placed, it has been useless in terms of telling us what to plan for.
We now have enough data to draw conclusions, not just about whether hurricanes are more frequent or whether we’ve just had a bad year, but to quantify by how much more frequent they are.
Compared to the century that preceded 2010, there has been a quantifiable increase. We can continue to use the map in Figure 1, but when estimating the mean time between hurricanes for your location, we should cut the time span in half. Hurricanes aren’t getting stronger, but they are occurring twice as often.
Considering Climate Change In Your Process Risk Assessment
Increasingly, federal agencies are requiring process facilities to consider climate change in their process risk assessments. It’s frustrating, however, that they give no guidance on what that means. At least for hurricanes, the data is telling us what to do. It doesn’t appear that we should expect consequences to be worse, but as part of a risk assessment, we should be planning on hurricanes striking our plants at twice the historic frequency.
