“A spark neglected makes a mighty fire.” Robert Herrick
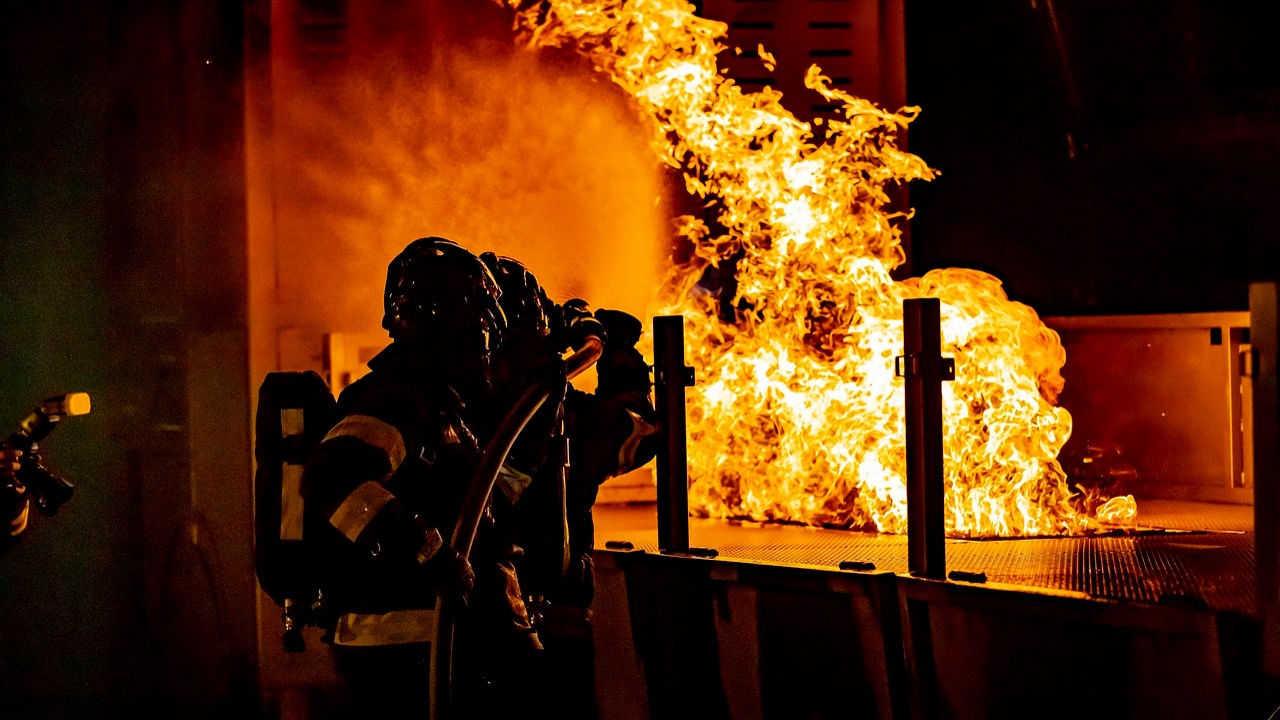
During a process hazard analysis (PHA) and a layer of protection analysis (LOPA), the scenario of an external plant fire frequently arises. From our experience facilitating PHAs and LOPAs, we’ve found that a common cause for this is a pooling of flammable liquid or oil getting soaked in insulation, resulting in an external fire. To define a reasonable frequency for this occurrence, we need to determine how often fires occur in chemical plants and refineries over a specific period of time, what the probability of a fire causing an explosion is, and what burns the most frequently.
Frequency of Fires
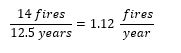
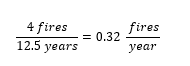
To answer this question, data was studied over a 12.5-year span (January 2000 – July 2013) for both refineries and chemical plants. In the United States, during this time frame, there were 150 refineries and approximately 171 fires reported in the Industrial Fire World database. The frequency calculation for the likelihood of a refinery experiencing an external fire over this 12.5-year period was:
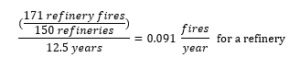
This means, on average, that a refinery can be expected to experience an external fire approximately once every 10 years.
While refineries typically handle flammable hydrocarbons, chemical plants handle a broad range of materials. Due to this range of materials, it is important to assess the frequency of a fire occurring because of handling flammable or combustible materials versus the frequency of a fire occurring at a plant that handles noncombustible materials.
During the time of this study, 13,500 chemical plants were operating in the United States. Of these 13,500 chemical plants, there were approximately 276 fires during the 12.5-year span.The fires at chemical plants which handle flammable or combustible material during this span accounted for 273 out of the 276 fires.
Assuming that chemical plants which handle flammable or combustible process materials accounted for 80% of the 13,500 chemical plants, the frequency with which a fire occurred at a chemical plant resulting from flammable or combustible process materials was:
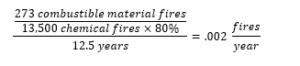
Given this value, it would be reasonable to expect a fire to occur around once every 500 years at any given chemical plant utilizing flammable or combustible process materials.
Fires at chemical plants resulting from combustibles other than process materials during this same period accounted for 3 out of the 276 fires. Under the assumption that 20% of the 13,500 chemical plants primarily use noncombustible materials in their process, the frequency with which a fire occurred was:
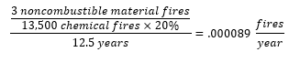
We should expect then, that at any chemical plant handling only noncombustible raw materials and finished products that a fire will occur no more than once every 12,000 years. It is important to note that although the likelihood of a chemical plant fire involving noncombustible material is small; a plant that has both combustible and non-combustible materials cannot take sole credit for a noncombustible fire, neglecting the combustible materials.
The frequency of fires at refinery plants versus fires at chemical plants handling flammable materials is statistically significant. This is despite the similarity of materials being handled and the unit operation being used. While there is no facile explanation for the difference, it is nonetheless real and must be taken into account.
Probability of fire causing an explosion
There is little difference between the probability of a fire causing an explosion at a chemical plant or at a refinery. The number of fires which caused explosions at chemical plants was 33 out of the 276 fires over the 12.5-year time period. The number of fires which caused explosions at refineries was 13 out of 171 fires over the 12.5-year time period.
The frequency of which chemical plant fires caused an explosion amounted to 12%, whereas the frequency at which refinery plant fires resulted in an explosion was 8%. The difference in probability of explosion between chemical plant fires and refinery fires is not statistically significant. Therefore, a frequency value can be calculated that provides an accurate representation of the number of explosions caused by fires for both chemical and refinery plants. This value, which is calculated by dividing the number of fires total resulting in an explosion by the number of total fires, results in a value of 0.10 process fires which caused explosions.
What this means is that 10% of all chemical and refinery plant fires caused explosions to occur. It would be reasonable to use this value when determining the frequency with which a specific facility would expect a fire to result in an explosion.
What burns?
When we understand what causes external fires, or where fires are primarily located in chemical plants and refineries, we can proactively target these specific hazards to help reduce the likelihood of a fire occurring. We have to ask ourselves different questions when evaluating what burned in a chemical plant versus what burned in a refinery.
Chemical Plants: What equipment burned?
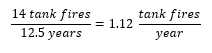
Of the 276 fires that occurred over the 12.5-years at chemical plants, the cause of most of them was identified by determining what burned. In most cases, the data provided did not identify which specific piece of equipment caused a fire to occur, but rather which pieces of equipment associated with chemical plant fires. According to Industrial Fire World database, the pieces of equipment associated most commonly with chemical plant fires included tanks, pumps, and general equipment.
The frequency of tank fires was:
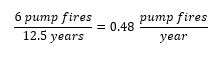
The frequency of pump fires was:
The frequency of equipment fires was:
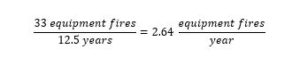
While these values represent a general frequency for where a fire occurred most often within a chemical plant, the values do not provide a breakdown for specific pieces of equipment, nor do they account for the chemical plants which did not identify a cause of the fire. However, in an effort to take a proactive approach to identifying hazards, a chemical facility could pay special attention to these specific pieces of equipment.
Refinery fires: What Unit?
It is understood that refinery fires are different than chemical fires. The difference between refinery fires and chemical fires comes down to their categorization. The descriptions associated with the sources of fires in refineries points to units within the facility, not just the equipment in a particular unit. Therefore, it is helpful to understand which units experienced fires most frequently in a refinery plant over the 12.5-year span.
While the following frequencies do not account for every refinery fire, the numbers represent a large subset of the 171 refinery fires that occurred over the 12.5-year span. The units that were specifically identified as experiencing a larger number of fires were: the crude oil processing unit, the coker unit, the alkylation unit, and the catalytic cracking unit.
The frequency with which the crude oil processing unit experience a fire was:
The frequency with which the coker unit experienced a fire was:
The frequency with which the alkylation and the catalytic cracking units experienced a fire was:
Conclusion
A review of the data indicates that external fires occur most frequently at refineries. The frequency of an external fire occurring at a chemical plant is considerably higher for plants that work with flammable materials than those that work with non-flammable materials.
When estimating frequency values to include in a PHA or LOPA, the following would be appropriate to use as a basis for justification. For refineries, this frequency with which an external fire is large enough to cause severe impacts is about once every 10 years. For chemical plants that use a flammable or combustible material, this frequency is around once every 500 years, or on an order of magnitude basis, once every 100 years. For chemical plants handling only noncombustible raw materials and finished products, this frequency is about once every 11,250 years, or very conservatively, once every 1,000 years.
Works Cited
“Chemical Manufacturing.” EPA. Environmental Protection Agency, n.d. Web. 19 July 2013. <http://www.epa.gov/sectors/sectorinfo/sectorprofiles/chemical.html>.
“List of Oil Refineries.” Wikipedia. Wikimedia Foundation, 18 July 2013. Web. 19 July 2013. Wikipedia citing the Oil & Gas Journal
White, David. “Incident Logs – Chemical Fires.” Industrial Fire World. Fireworld, n.d. Web. 19 July 2013. <http://fireworld.com/IncidentLogs/tabid/101/articleType/Search/currentpage/22/Default.aspx?Search=chemical+plant>.
White, David. “Incident Logs – Refinery Fires.” Industrial Fire World. Fireworld, n.d. Web. 19 July 2013. <http://fireworld.com/IncidentLogs/tabid/101/articleType/Search/currentpage/1/Default.aspx?Search=refinery+>.
Excellent material. Congratulations.