
“One can state, without exaggeration, that the observation of and the search for similarities and differences are the basis of all human knowledge.” — Alfred Nobel
Yearly, the Bureau of Labor Statistics publishes fatality data for the U.S. workplace, private and public. Usually, it is in December for the previous year. Because of the government shutdown this past fall, however, the BLS didn’t publish the data for 2024 until late in February 2026.
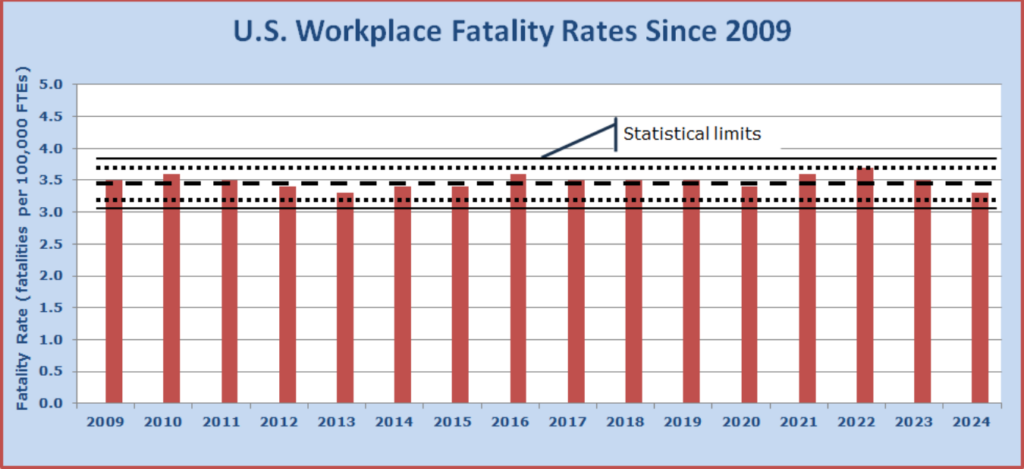
The news is that there was no news. The number of work-related fatalities in 2024 was 5,070, down from 5,283 in 2023. While a decrease is always encouraging, perhaps even a harbinger of improvements to come, the change was not statistically significant. Likewise, the overall fatality rate in 2024 was 3.3 fatalities per 100,000 full-time equivalents, down from 3.5, but within 2σ of the 3.48 average we’ve experienced since 2009.
Ten Deadliest Occupations
The ten deadliest occupations in the U.S. are also largely unchanged:
- 110 fatalities per 100,000 FTEs: Logging
- 89 fatalities per 100,000 FTEs: Fishing and hunting
- 49 fatalities per 100,000 FTEs: Roofing
- 38 fatalities per 100,000 FTEs: Structural iron work
- 37 fatalities per 100,000 FTEs: Refuse and recycling
- 37 fatalities per 100,000 FTEs: Aircraft pilots and navigators
- 36 fatalities per 100,000 FTEs: Construction helpers
- 36 fatalities per 100,000 FTEs: Underground mining
- 26 fatalities per 100,000 FTEs: Truck driving
- 21 fatalities per 100,000 FTEs: Groundskeeping
For those concerned with the safety of workers in the chemical process industries, it is a relief to see that chemical process worker is not on the worst ten list. Nor has it been as long as the list has existed.
So, how do the chemical process industries compare to the U.S. workplace as a whole?
Fatality Rates
The fatality rate for workers in the U.S. in 2024 was 3.3 fatalities per 100,000 FTEs.
One way to view the chemical process industries (CPI) are those industries classified in the North American Industrial Classification System as 324, 325, or 326. The BLS reports both the employment and the number of fatalities for each of these industry sectors, so it is possible to estimate the fatality rate for each:
- NAICS code 324: Petroleum and coal products manufacturing:
7 fatalities per 108,200 employees à 5 fatalities per 100,000 workers - NAICS code 325: Chemical manufacturing
17 fatalities per 899,000 employees à 9 fatalities per 100,000 workers - NAICS code 326: Plastics and rubber products manufacturing
28 fatalities per 697,800 employees à 0 fatalities per 100,000 workers
Overall, the fatality rate in the CPI is 3.0 fatalities per 100,000 workers, which is less than the fatality rate for the U.S. workforce as a whole. However, there are meaningful differences between the sectors, especially between chemical plants and refineries. Given that they use many of the same unit operations, that difference invites some introspection by refinery operators. Why is the fatality rate at refineries more than three times higher than at chemical producers?
How People Die on the Job
The BLS classifies injuries, illnesses, and fatalities as resulting from one of seven types of events. The seventh type – strains – does not show up on summaries of fatalities. It turns out that we don’t strain ourselves to death. The other six do. In 2024, this is how work-related fatalities were distributed:
- 1,937 Transportation
- 844 Slips, trips, and falls
- 756 Contact with objects
- 733 Workplace violence
- 687 Harmful exposure
- 93 Fires and explosions
- 20 Not categorized
It is easy to look at these categories and conclude that “Harmful exposure” and “Fires and explosions” capture the bulk of process safety issues. However, harmful exposure includes electrocution, heat stroke, and drowning, as well as exposure to harmful substances. Further complicating a simplistic review is that the BLS categorizes drug and alcohol overdoses in a workplace setting as exposure to harmful substances; 60% of all fatalities from “harmful exposure” resulted from drug and alcohol overdoses.
Still, there is something to be learned from comparing the differences between the CPI and the general workplace. To get a statistically meaningful sample from the CPI, we looked at a composite of data for the CPI from 2015 to 2024 (this is just 9 years of data because, inexplicably, the BLS has never reported data for the entire manufacturing sector during 2019) and compared with the recently reported for the entire U.S. economy.
Comparison by Type of Event
Transportation – In 2024, transportation-related worker fatalities in the U.S. accounted for 38% of all work-related fatalities. This is about the same as it has been for decades. During 2015 to 2024, transportation-related worker fatalities accounted for 10% of U.S. CPI work-related fatalities. Perhaps chemical workers are more careful drivers than the general U.S. workforce, or perhaps driving is simply a less significant part of the work in the CPI.
Slip, trips, and falls – In 2024, slips, trips, and falls accounted for 17% of all work-related fatalities in the U.S. About the same as usual. During 2015 to 2024, slips, trips, and falls accounted for 11% of U.S. CPI work-related fatalities. Again, less than the general U.S. workforce. It appears that the precautions the industry takes when there are slip hazards or when it is necessary to work at height are bearing fruit.
Contact with objects – In 2024, contact with objects accounted for 15% of all work-related fatalities in the U.S. Again, about the same as usual. The U.S. CPI did much worse. During 2015 to 2024, contact with objects accounted for 37% of U.S. CPI work-related fatalities. This is a surprise, and perhaps, an opportunity for improvement.
Workplace violence – In 2024, workplace violence accounted for 15% of all work-related fatalities in the United States, mostly by shooting. Victims of workplace violence includes late-night clerks who are killed during robberies, as well workers who are killed at work by estranged partners and disgruntled coworkers. Workers in the U.S. CPI appear to be less vulnerable to workplace violence; during 2015 to 2024, workplace violence accounted for 10% of U.S. CPI work-related fatalities.
Harmful exposure – In 2024, harmful exposure accounted for 14% of all work-related fatalities in the U.S. In the past, harmful exposure accounted for a much smaller proportion of work-related fatalities in the U.S. It fell steadily until 2013, when the 3rd wave of the opioid crisis hit the U.S. It has been climbing ever since. In the U.S. CPI, during 2015 to 2024, harmful exposures accounted for 21% of work-related fatalities. Certainly, the U.S. CPI has not escaped the opioid crisis, but the excess is entirely attributable to the hazardous materials and environments in which the CPI works.
Fires and explosions – In 2024, fires and explosions accounted for 2% of all work-related fatalities in the U.S. This is about the same as it has been for years. During, 2015 to 2024, fires and explosions accounted for 6% of work-related fatalities in the U.S. CPI. It should not be unexpected that fires and explosions are much more deadly in the chemical industries than in the general workplace.
What Do These Differences Tell Us?
There are three types of events – transportation, workplace violence, and slips, trips, and falls – where the U.S. CPI is better than the U.S. in general. In these areas, the industry should continue with its current efforts, but additional effort is probably a misallocation of resources.
There are two types of events – harmful exposure and fire and explosion – which any thoughtful person would have expected to be worse in the chemical industry than in the U.S. workplace in general. They are. This reinforces the need for process safety management and all its elements.
The big surprise is contact with objects. The proportion of fatalities in the chemical industry is over twice as high as the proportion of fatalities in U.S. workplace in general. This is an area where we should all be focusing our attention because this represents the greatest opportunity for improvement.