“Same as it ever was…Same as it ever was…Same as it ever was…Same as it ever was…Same as it ever was…” — David Byrne, Talking Heads
I had such fears. I feared that after seeing the work-related fatality rate climb for two years in a row, we were going to see it climb once again, a harbinger of a statistically significant upward trend.
Instead—it’s the same as it ever was. We’re not getting worse!
The Same As It Ever Was
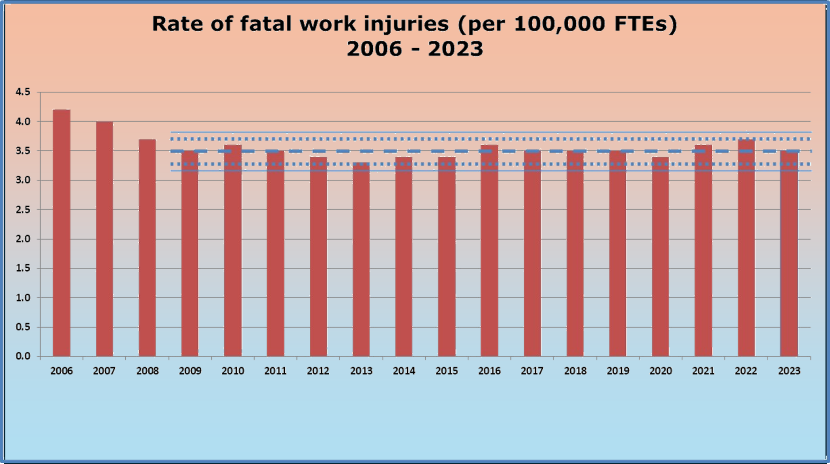
We’ve been writing and posting blogs on safety since 2016. Every December or January, we’ve taken a look at the work-related fatality statistics just published by the BLS for the prior year. And every year, we’ve noticed that nothing has really changed. This December, the BLS posted the data for 2023. Once again, nothing has really changed.
Since 2009, when the overall fatality rate was 3.5 fatalities per 100,000 full time equivalents (FTEs), the overall fatality rate has averaged 3.493, with a standard deviation of 0.100. If that trend were a process run chart, it would clearly be in statistical process control.
Causes of Fatalities
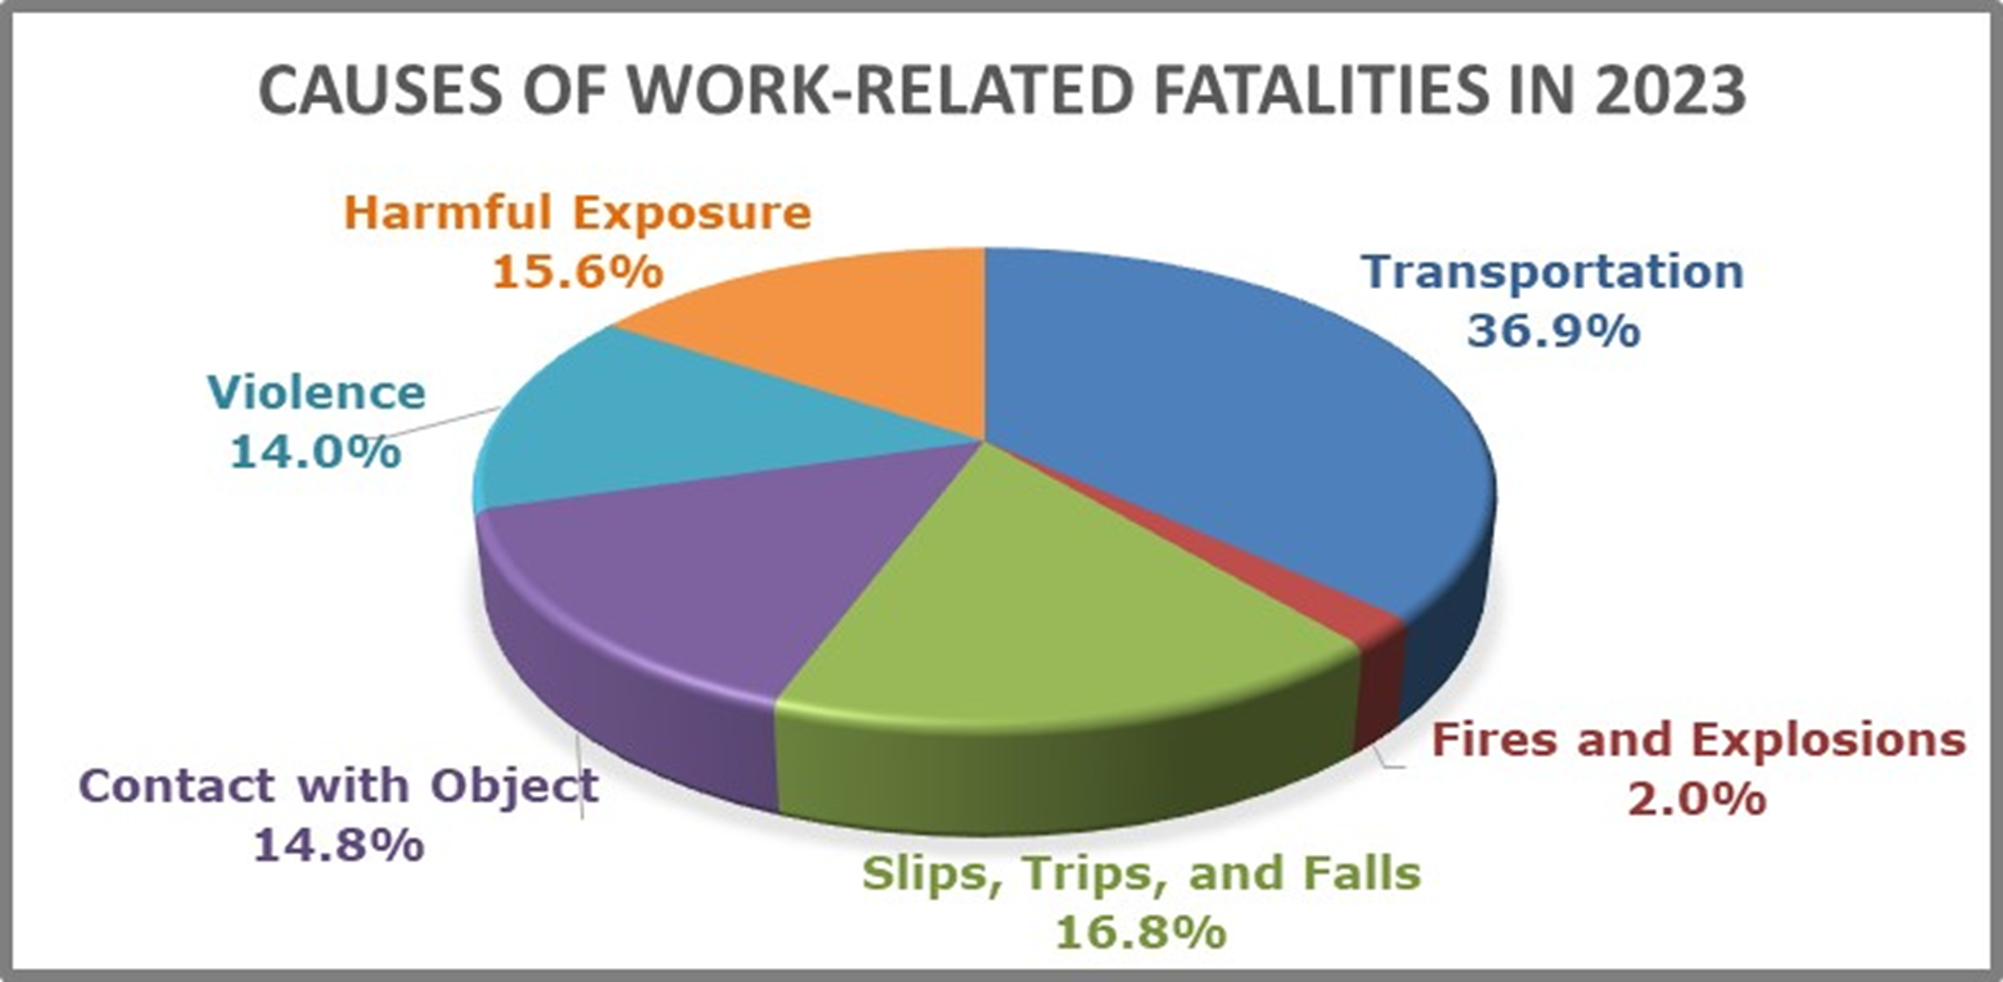
Just as the overall work-related fatality rate is the same as it ever was, so are the causes for the most part. The BLS characterizes the causes of work-related injuries as one of seven types of events. As always, strains, while causing injuries, do not cause fatal injuries. The other six types of events contribute about as much to fatal work-related injuries as they always have.

Figure 1. Contribution of Causes of work-related fatalities to overall fatality rate in 2023
There are two areas that warrant comment. Transportation, primarily motor vehicle wrecks, has historically contributed around 40% to the overall fatality rate. It’s still around 40%, but it is showing a downward trend. Since this is a percentage, that means that something else must be going up.
It is harmful exposure.
There are a lot of hazards that constitute “harmful exposure”. Exposure to hazardous chemicals comes immediately to mind to those of us working in the chemical process industries. However, harmful exposure also includes drowning, electrocution, and heat stress. But none of these is the cause for increasing harmful exposure.
It’s drug overdose. The opiate crisis continues to plague the workplace.
Dangerous Occupations
Over the years, we’ve also tracked the most dangerous occupations. Not necessarily the occupations that kill the most people, but the occupations with the highest fatality rates. The five deadliest occupations are no different than what we have seen for decades:
- 99 fatalities per 100,000 FTEs Loggers
- 87 fatalities per 100,000 FTEs Commercial fishers
- 52 fatalities per 100,000 FTEs Roofers
- 41 fatalities per 100,000 FTEs Trash collectors
- 31 fatalities per 100,000 FTEs Pilots and flight engineers
Loggers and commercial fishers continue to vie for most dangerous and second most dangerous jobs, with little improvement. Roofing remains about as dangerous as it has always been, which tells us that the current strategy for fall protection is not improving things.
Trash collection, which has always been dangerous, has almost doubled over recent years. It’s disappointing, because I had high hopes that the increasing mechanization of trash collection was making a permanent change in the safety of that occupation.
Rounding out the worst five occupations is flying airplanes. Pilots and flight engineers suffered a fatality rate of 91 fatalities per 100,000 FTEs and were ranked 3rd in 2006. The fatality rate has been dropping since then; in 2023 it was down two-thirds to 31 fatalities per 100,000 FTEs. I would not be surprised to see it drop out of the worst five in coming years.
Embrace New Initiatives
The first step to improving a process is to get it in statistical process control. It is only then that we can successfully make the control limits tighter, or in our case, drive those limits lower. We shouldn’t be satisfied with an annual fatality rate of 3.5 fatalities per 100,000 FTEs. If we just keep doing what we are already doing, the levels are just going to stay the same—sometimes up, sometimes down, but within a band of 3.3 to 3.7, with rare excursions down to 3.2 or up to 3.8.
We should be eager to find ways to drive the work-related fatality rate down. To drive it down, we need to do something else. Not instead of what we are already doing, but in addition to what we are doing. It’s hard to embrace change, but without change, it will be the same as it ever was.
